A little Numbers know-how and a lot of free time are a dangerous combination.
I took the sample I used last time to compute something I call the expected hensachi, a score along the same range of hensachis from the last sample – 46 to 75 – but calibrated to schools’ component scores in the THE Rankings. I did this to provide something to contrast with schools’ observed hensachis, which again came from this site. Expected hensachis were calculated by this simple method:
(school’s component score – minimum observed component score) / range of component scores * range of observed hensachis + minimum observed hensachi
(I was asked last time to provide an analysis of the components of universities’ hensachi scores. They are based on two tests – the センター試験sentaa shiken (National Center Test for University Admissions) and universities’ own tests for each academic department, both of which must be taken in most cases. Cram schools figure out the hensachis based on internal calculations and make them available to students and sometimes to the public. This site presents scores required for entrance in two formats: raw scores and percentages for the Center, and hensachis for universities’ own exams. I can’t say, or don’t have the time to look for, how cram schools get their data.)
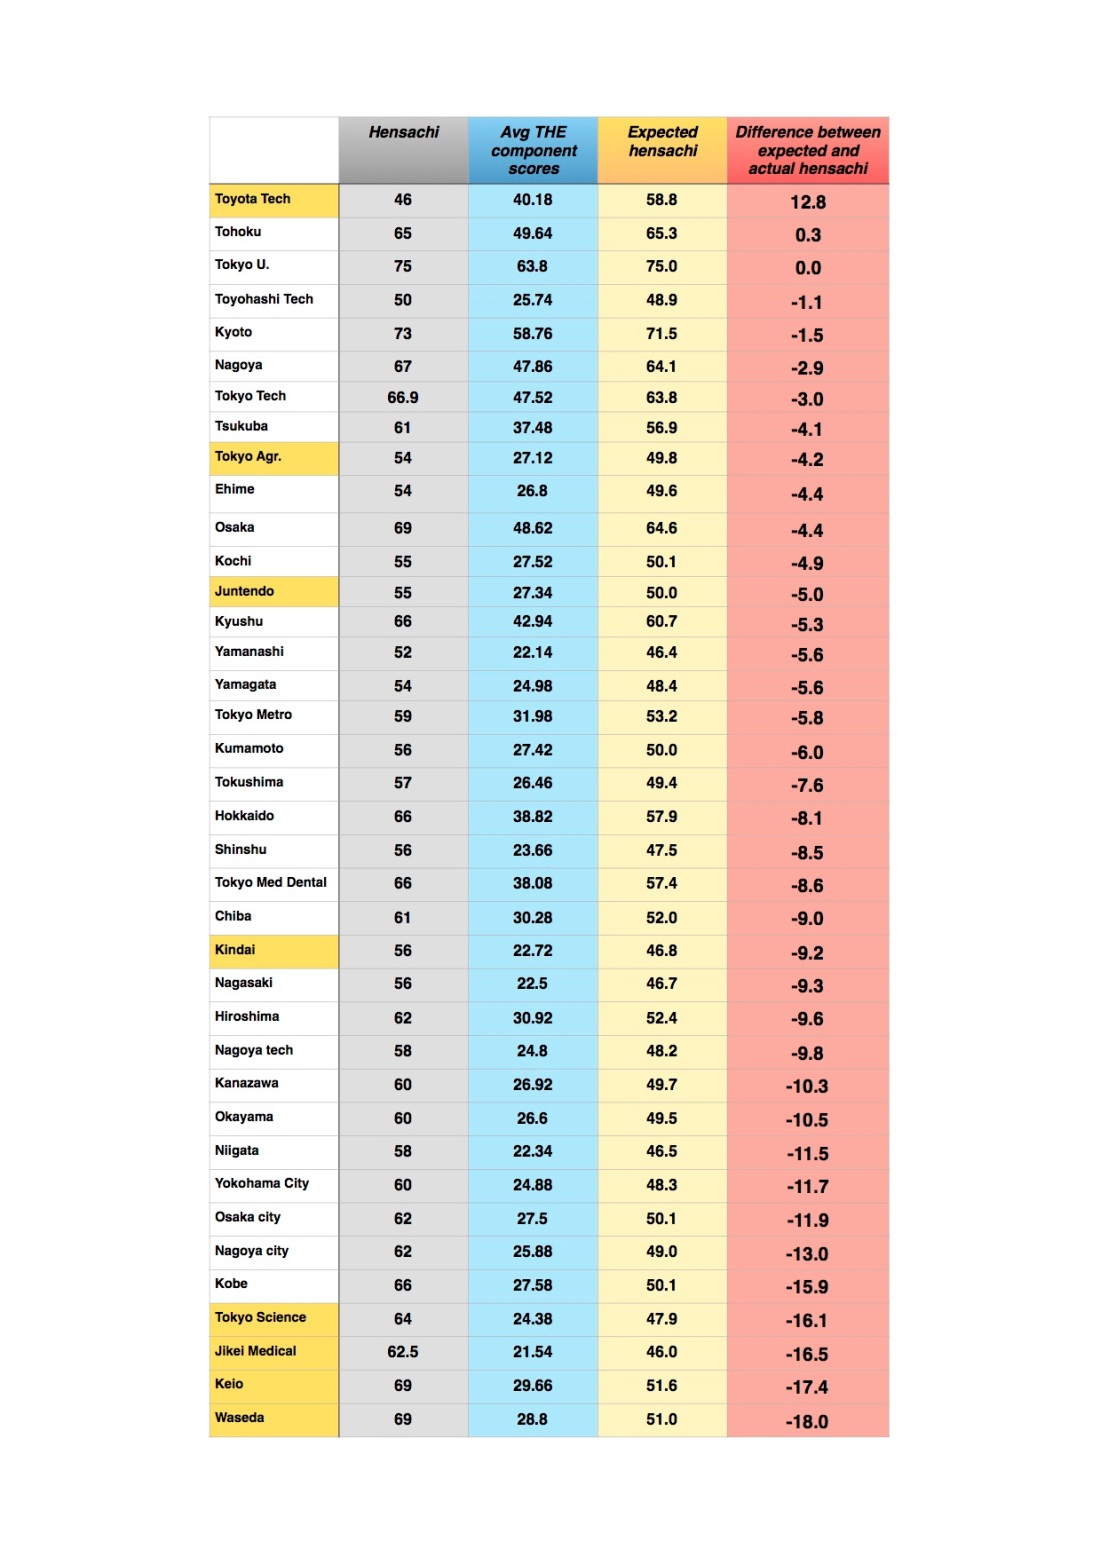
Tokyo University has the highest THE component scores and the highest hensachi, so its expected hensachi is still 75. The school with the lowest component scores, Jikei University School of Medicine (ouch!), gets the lowest expected hensachi with 46 (Toyota Tech’s score in the observed actual hensachis). A school halfway between the ceiling provided by Tokyo U and the floor provided by Jikei gets an expected hensachi halfway as well; Kyushu University’s half-full, half-empty component scores leave it with an expected hensachi of 60.7, which is less than its observed hensachi of 66.
As you might suspect, this leaves some schools with expected hensachis quite different from their actual hensachis. Read on to check out a chart ordered from the largest positive difference between actual and expected hensachi to largest negative.
This next chart is similar, but only uses the Teaching component score from the THE Rankings. This is because, as I pointed out last time and as a few commenters agreed (and special thanks to Michael for a citation giving much more detail on the lack of synergy between university professors’ research and undergraduate teaching), Teaching is the most relevant part of the university experience for undergrads.

So you may have noticed that Toyota Technological Institute places at the top of both charts. Good for them! Assuming millions of Japanese high schoolers and their juku teachers read this post, Toyota Tech’s competitiveness in Japanese higher education will surely rise. RT this post to help them along.
Some universities fare better than others. According to the average THE component scores, Keiō and Waseda (Japan’s premier private universities) ought to offer admission to any student slightly better than average, but THE Top 100 Tōkyō and Kyōto are appropriately selective. If Japanese students’ ambitions tracked THE-rated expectations of quality teaching, way more of them would be trying to get into frostbitten Tohoku and Hokkaido Universities than any public university on the southern islands of Shikoku or Kyushu (Kōchi, Ehime, Kumamoto, Tokushima, or Kyūshū).
Both charts also have a serious negative bent. This supports the claim that to some extent, hensachi are inflated. Whether you base your assessment of universities to their overall influence or simply to those parts that are most likely to affect undergraduates, most universities in Japan in the THE Rankings should be much easier to get into. They certainly would be, if Japanese students didn’t attend college in such high rates or didn’t overwhelmingly prefer domestic universities to higher-THE-ranked ones overseas.
The reasons for this domestic preference are outlined in this article, and follow patterns that should be familiar to anyone living in Japan – cost (Tokyo University is about $5000/year. My alma mater UC Irvine is twice that, about the same as a private Japanese university), language ability, insularity, and job-hunting culture. Unfortunately the latter three seem to be confining Japanese students to a system which pushes them to work very hard for a mediocre undergraduate experience – or at least one whose character is determined, like the high school experience, by factors external to the schools themselves.
Addendum: The expected hensachis for the MARCH schools – prestigious private universities that are not Keiō or Waseda – are as follows:
- Meiji University – 44.2 based only on Teaching, 45.8 based on all component scores
- Chūō University – 48 Teaching, 45.6 all
- Hōsei University – 43.9 Teaching, 43.1 all
Aoyama and Rikkyō, falling outside of the THE Top 980, have no component scores available.
So yes, if hensachis tracked THE Rankings, the MARCH schools should accept between 75% and 58% of all test-takers.

One thought on “THE Rankings and Hensachi, pt. 2 – Expected and Observed Hensachi”